
Ground truth you can build on.
Real-time and historical observations from physical stations, forecasts for the places you operate, and a way to measure which forecast actually performs there — in one portal and one API.
No sales call needed to start. Read the API documentation ↗
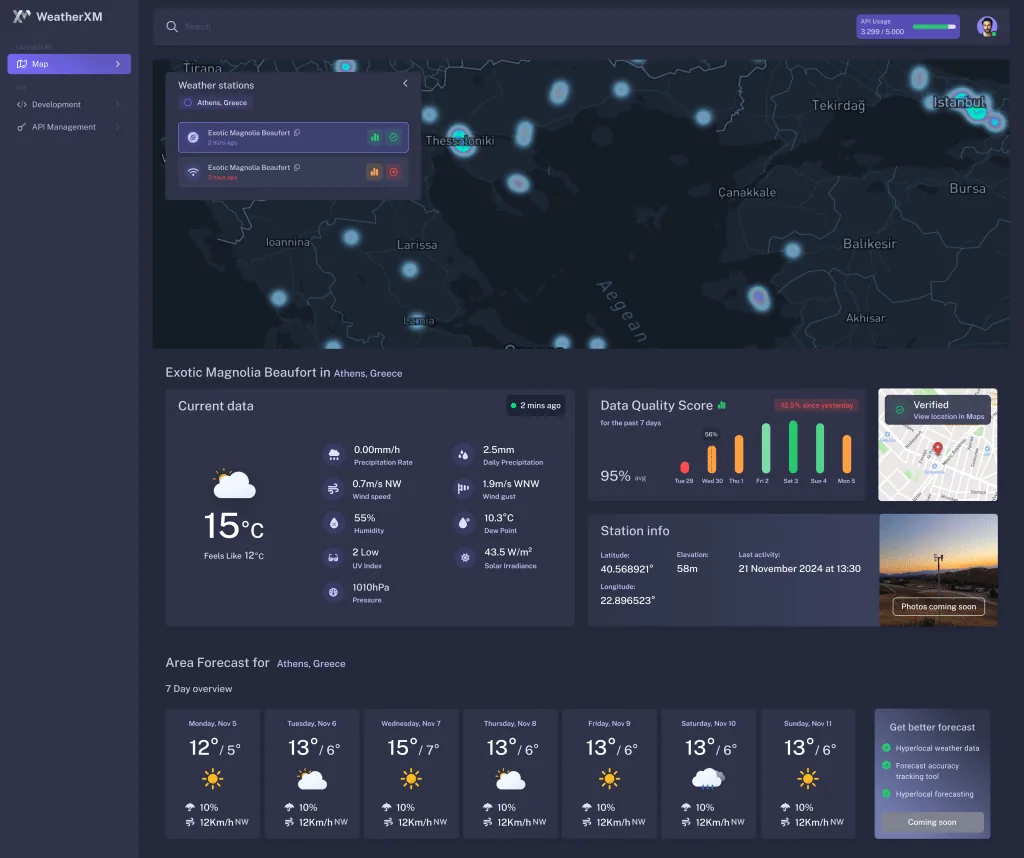
Network snapshot: August 2026. FACT model count per WeatherXM Pro documentation.
Data used by utilities, operators, insurers and AI teams
-
 Data customer
 -
 Distribution
 -
 Utility deployment
 -
 Line rating
 -
 Grid operator
 -
 Gas demand
 -
 Port operations
 -
 Motorway ops
Weather data matters when it changes a decision.
Global models average conditions across grid cells kilometres wide. Operations, contracts and risk are decided at a specific substation, quay, field or venue. That gap is what WeatherXM measures.
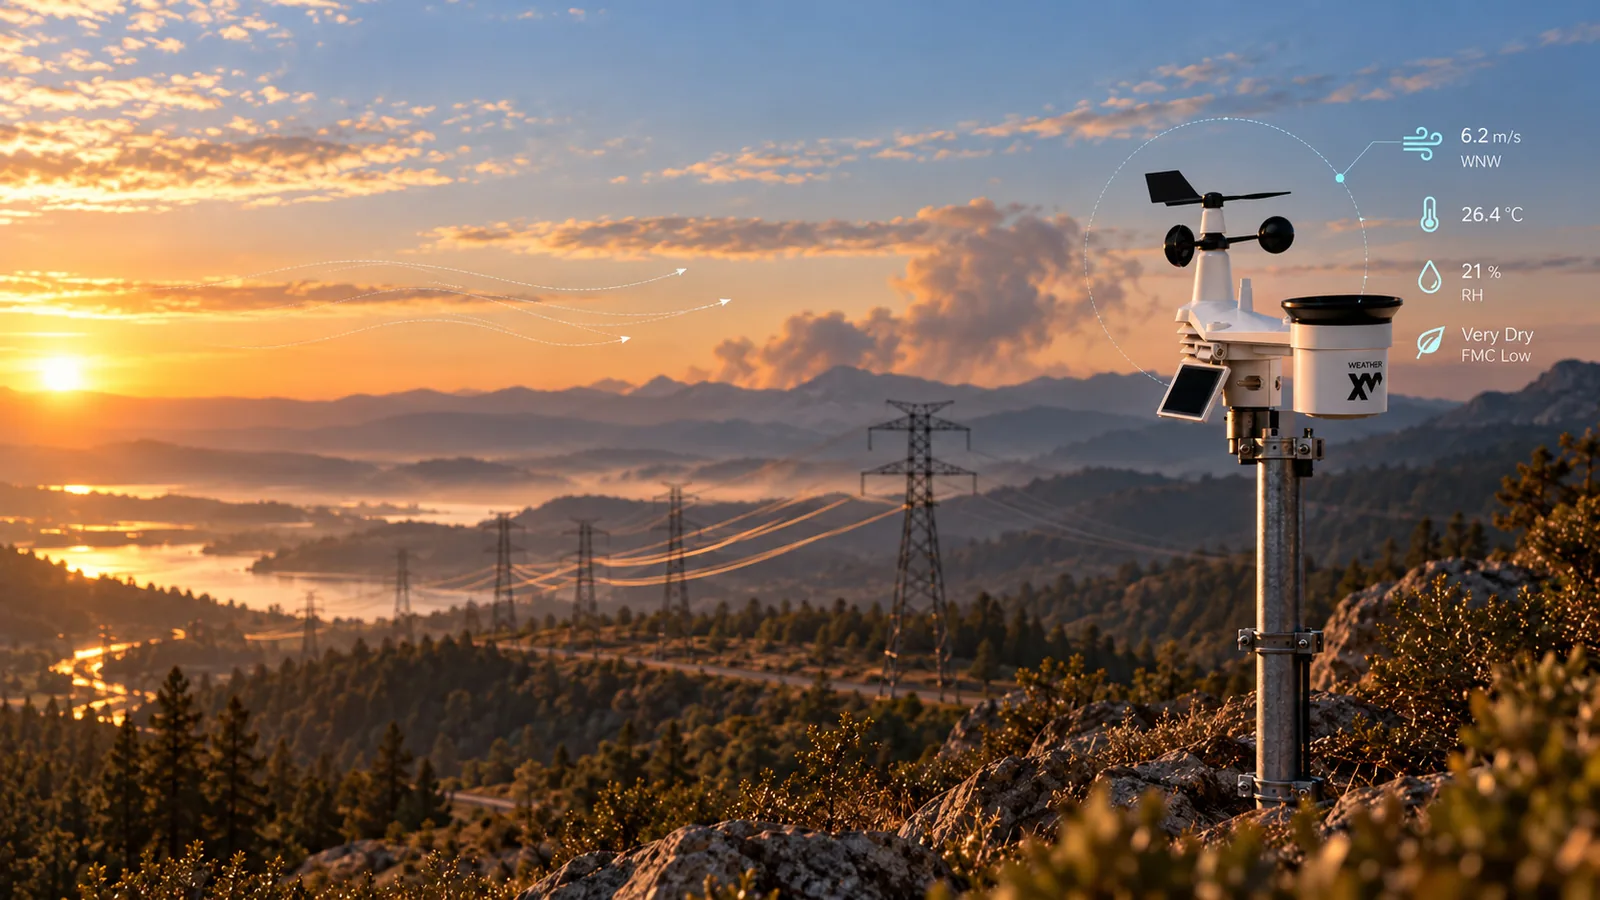
Demand, generation and line capacity
Local temperature and wind feed electricity- and gas-demand forecasting, grid balancing and dynamic line rating, where a regional grid cell hides the conditions at the asset.
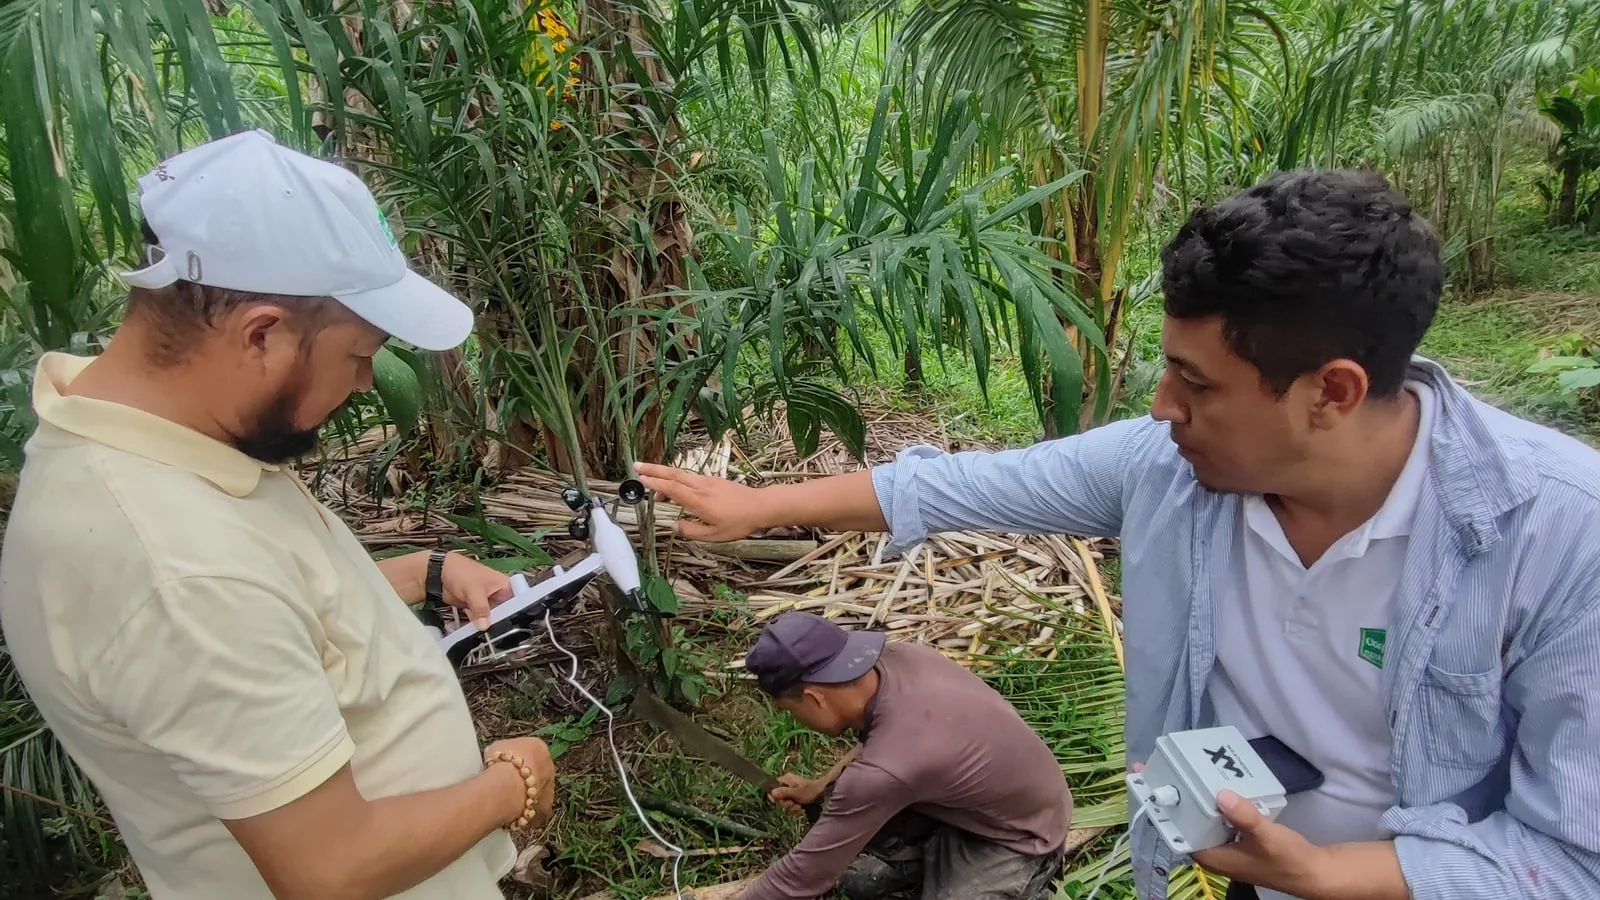
Parametric triggers and field decisions
Rainfall and temperature measured at the farm rather than at an airport tens of kilometres away — for index design, trigger monitoring and irrigation, frost and harvest planning.

Operating limits where the work happens
Quay-level wind for crane and berth operations, and weather along motorway corridors for safety and maintenance — measured on site instead of inferred from a distant proxy.
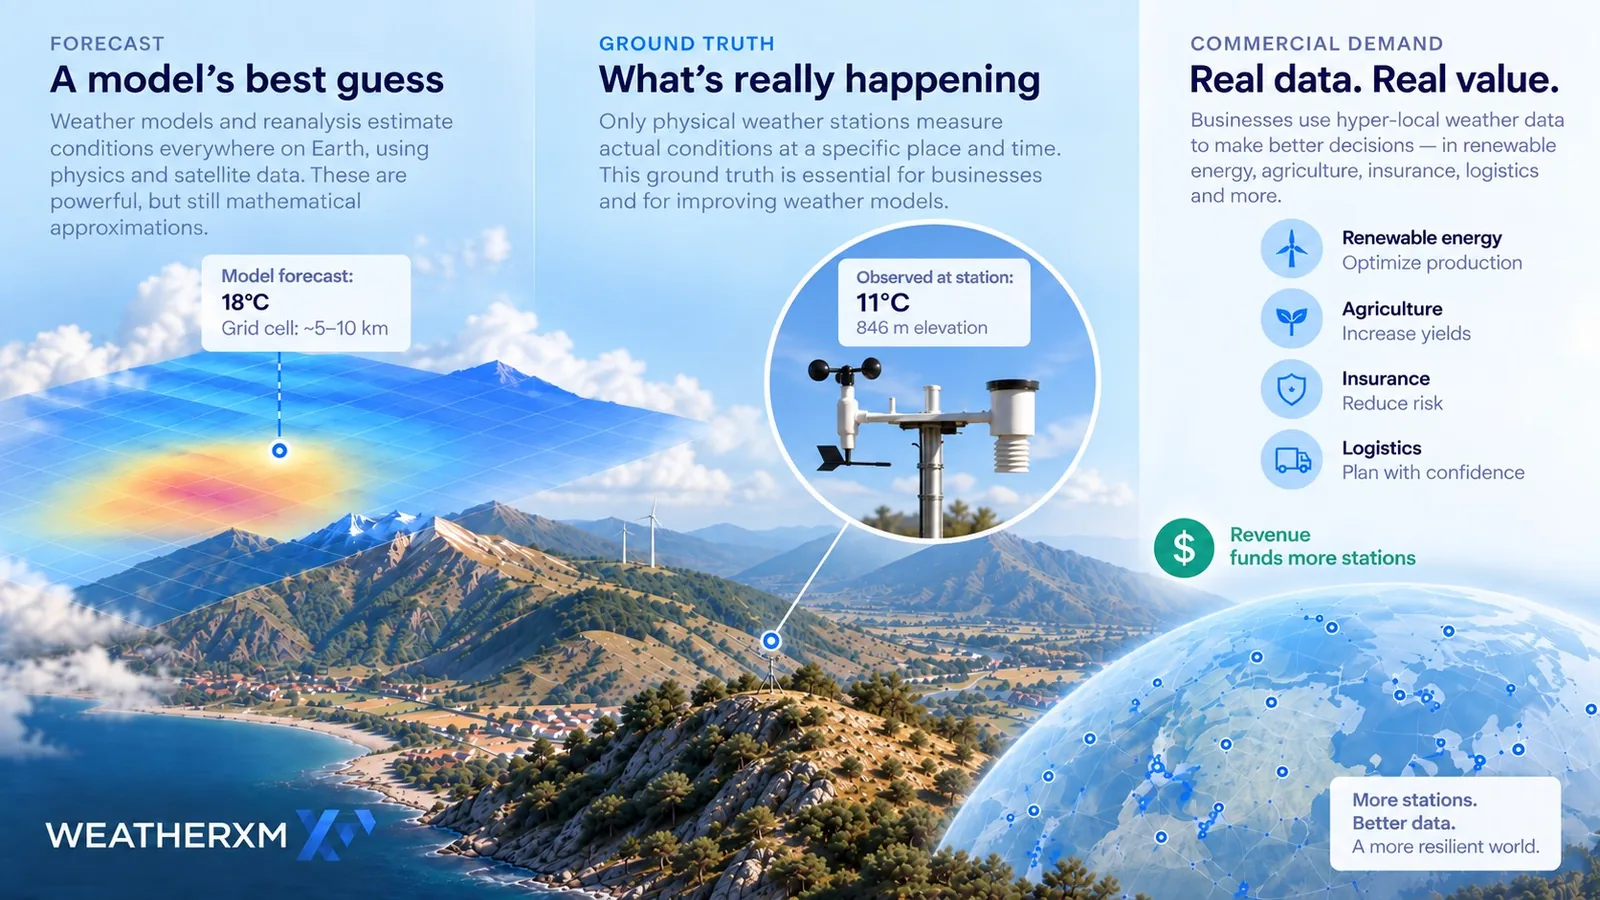
Ground truth for models and marketplaces
Dense surface observations to train and evaluate weather models, and to extend data platforms your teams already buy from.
Observe. Forecast. Verify.
Real-time and historical measurements, with station context and a quality score on every observation.
Forecasts for station locations and H3 cells, next to the measurements they need to represent.
FACT measures forecast error against what the station observed, by variable and lead time.
Measurements from the places where decisions happen.
Stations at farms, ports, energy assets, venues and homes report temperature, humidity, pressure, wind, rain, solar and UV. Use current readings for operations, and history for analytics, model training and forecast validation.
We design the stations, test each production batch, ask every owner for installation photos and monitor each unit continuously. That knowledge is what turns a raw signal into a dependable series.
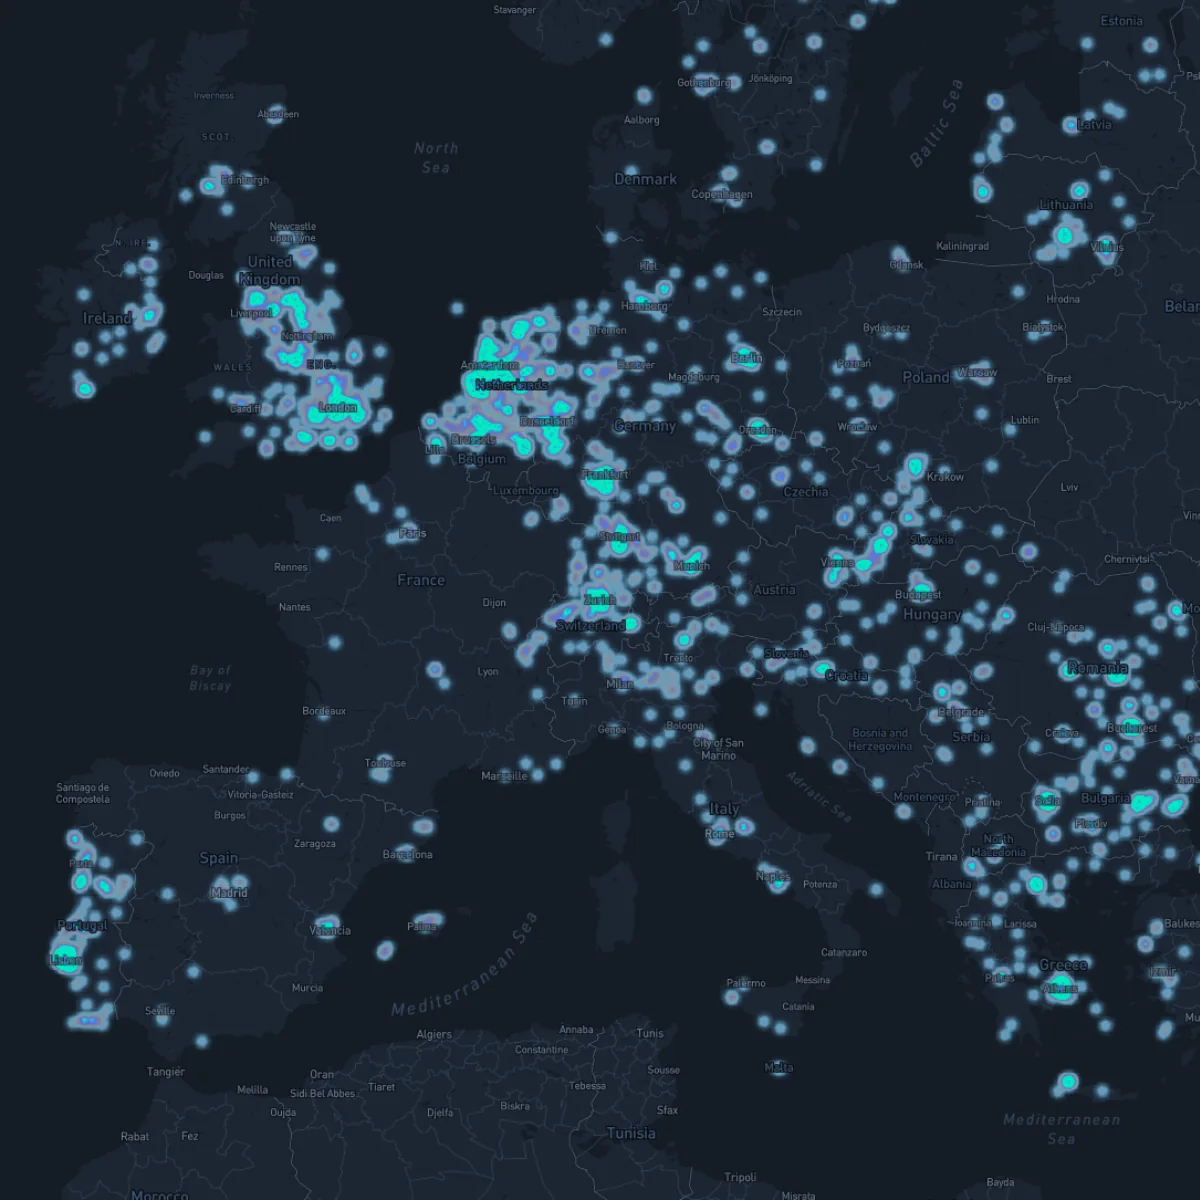
Two ways to take the observations.
Raw data
Your methodsThe record as the stations reported it, with quality annotations attached.
- Best for
- Teams with in-house weather science and their own filtering and bias correction
- You supply
- Station triage, filtering and bias handling
Enhanced data
Operational teamsThe same observations after hardware-model, production-batch, installation and lifecycle corrections.
- Best for
- Teams who need a dependable series and want to spend their time on their own product
- You supply
- Locations, variables and period
For real-time use, note that an observation's timestamp, its aggregation interval and the moment it becomes available through the API are three different things. Ask us about latency for your workflow.
Forecasts for the places you work.
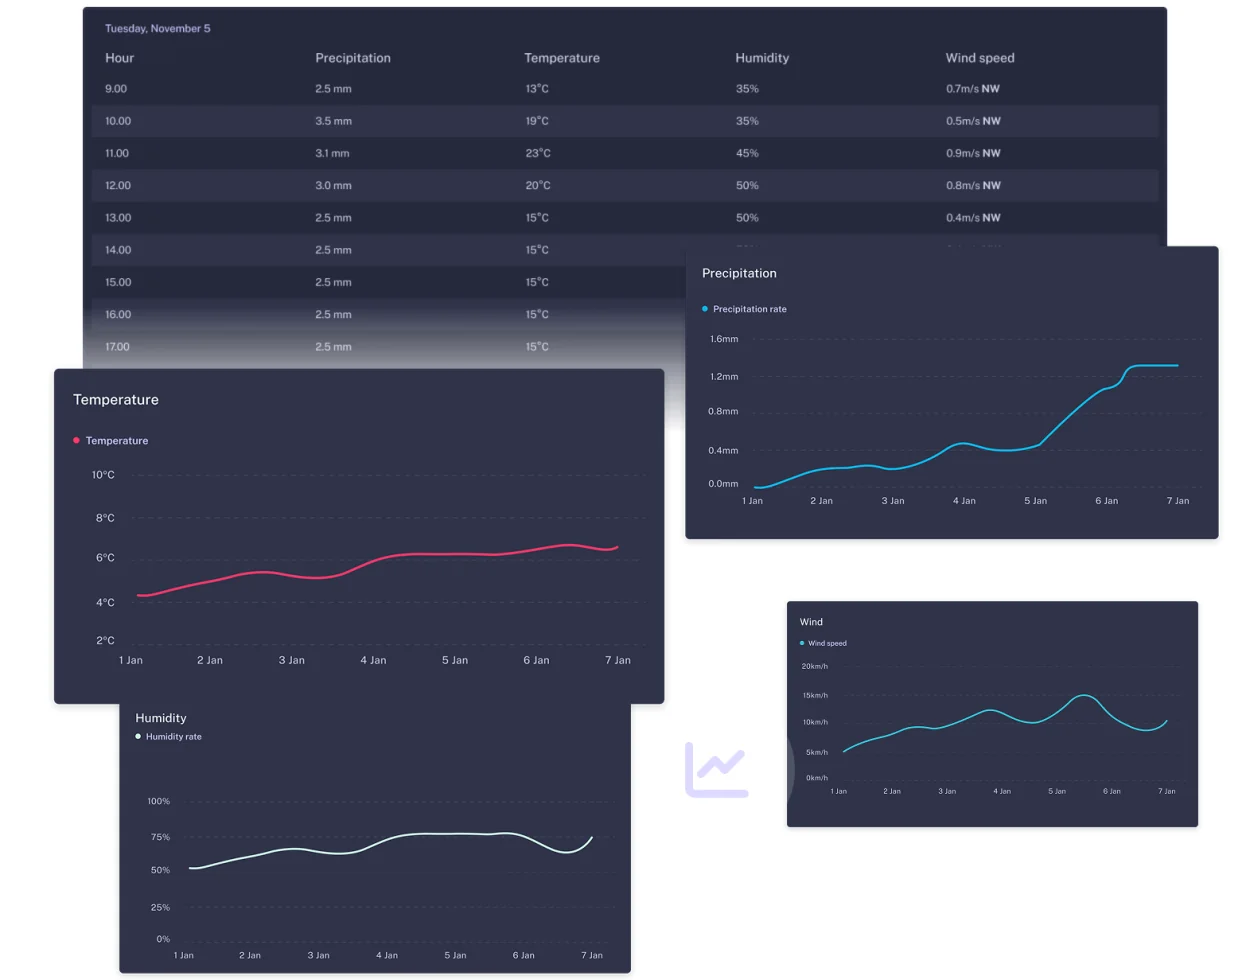
Hourly and daily forecasts for station locations and H3 cells, delivered through Pro and the API next to the observations from the same place — so you can prepare for what is coming and review what happened.
- Station-level forecasts that use local ground observations, not only a global grid.
- The forecast as it was issued. Archived forecasts keep what a model predicted before the weather happened — the basis for honest evaluation.
- Project requirements for particular models, lead times or delivery are scoped with you.
Don't guess which forecast is best. Measure it.
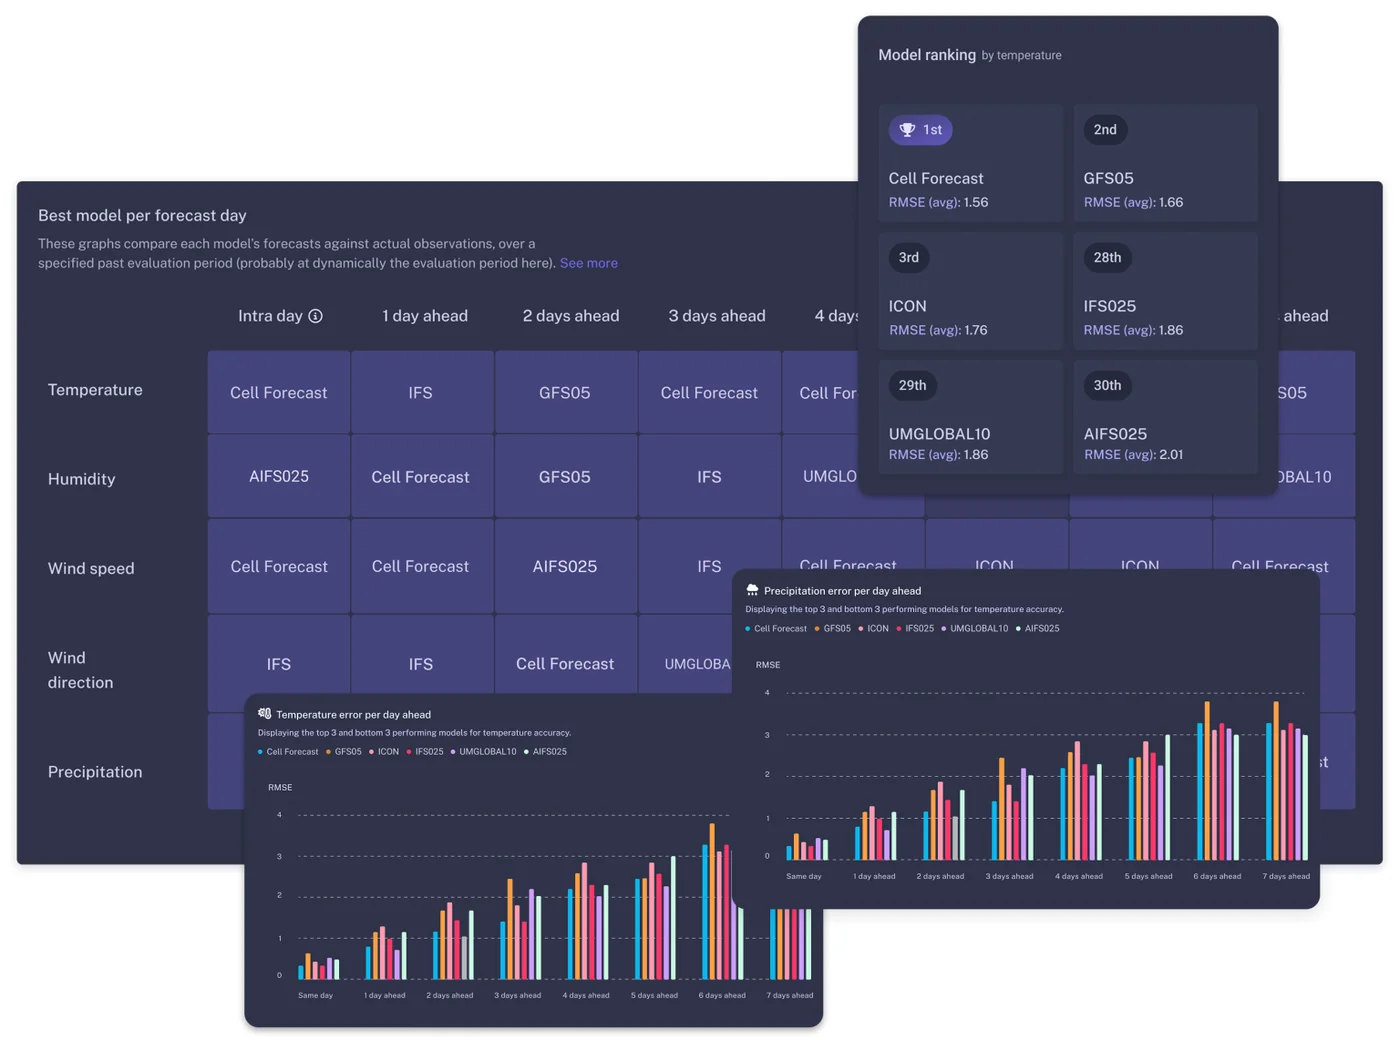
FACT archives forecasts before the weather happens, then scores them against what WeatherXM stations actually measured at the same place and time. The public 2025 benchmark contains 1.83 billion forecast evaluations across 45 models and 9,570 quality-checked ground stations.
See forecast skill change by model, variable, location and lead time.
The public FACT explorer lets you switch variables and forecast horizons, inspect model degradation curves, compare local winners on the map and browse a station-level leaderboard. It is a sample of the 2025 evaluation archive, designed to make the verification method visible rather than hide model performance behind a single score.
The archive includes global, regional, AI and post-processed forecasts. Coverage differs by model and geography, so FACT compares like-for-like samples rather than assuming one model is universally best.
Open the 2025 explorer ↗Keep the issued forecast, model identity, issue time, target time and lead horizon before the event occurs.
When the target hour arrives, match the forecast with quality-checked measurements from the WeatherXM station at that location.
Use metrics such as MAE and RMSE — and event skill scores for precipitation — to see which model performs for the decision you care about.
Bring your own forecast.
Already pay for a forecast? FACT can evaluate customer-supplied or third-party forecasts against local observations, so you can see how your current provider performs where you operate.
Mosaic
Enterprise · per locationOnce models are ranked against the ground, you can stop picking one. Mosaic reads the FACT evaluation for a location and assembles a forecast from the best-performing model for each day ahead. It is enabled per location in enterprise engagements.
Discuss a Mosaic evaluation →Know where every observation came from — and how good it is.
Provenance and quality are separate questions, and we answer both. Then we publish the method, including where our stations disagree with reference instruments.
Signed at the source
Supported stations sign each observation in hardware, so it stays verifiable over Wi-Fi, LoRaWAN, cellular or mesh.
Scored for quality
Automated Quality of Data (QoD) checks plausibility, consistency and deployment context, and attaches a score before delivery.
How we assess quality →Methods published
Comparisons with WMO-compliant reference stations, siting experiments and fleet corrections are public — faults included.
Read the Field Notes →Year-long comparisons with airport SYNOP/ASOS stations in Greece, the US and Croatia: temperature, wind and precipitation agreement, and the effect of mast height and siting.
Start self-service. Scale by agreement.
Most teams start in WeatherXM Pro the same day. Talk to us when the scope needs a commercial agreement: regional licensing, bulk history, custom evaluation or new stations.
Current self-service plans and limits are in Pro ↗. Research access is arranged case by case.
Explore in the portal. Integrate through the API.
WeatherXM Pro is where analysts explore sites, observations, forecasts and FACT. The REST API exposes the same data to your software with a single API key.
-
GET /stations/nearStations around a point and radius -
GET /stations/{id}/latestLatest observation with quality context -
GET /stations/{id}/historyHistorical observations by date -
GET /cells/{h3}/forecastDaily or hourly forecast for an H3 cell -
GET /stations/{id}/hyperlocalStation-level forecast for a variable -
GET /stations/{id}/fact/performanceForecast error by model and lead time
Machine-native access when you need it.
The REST API is the primary integration surface. These interfaces extend it for agents and automated pipelines.
Open-source server exposing stations, observations, forecasts and FACT to MCP clients. Needs a Pro API key.
View on GitHub ↗Machine-to-machine weather access with per-request payment over x402.
Explore the Agent API ↗Discover dataset slices for research and model training through the dataset index.
Open the dataset index ↗Before you evaluate.
Do I need to talk to sales to get started?
No. WeatherXM Pro is self-service: create an account, explore stations near your sites and generate an API key. Talk to us when you need regional licensing, bulk history, custom evaluation work or new stations.
Raw or Enhanced — which data should we take?
Raw is the reported signal with quality annotations, for teams with in-house weather science. Enhanced applies what we know about each hardware model, production batch and installation, so you receive a cleaner series. Most operational teams start with Enhanced.
Can you evaluate the forecast provider we already pay for?
Yes, where the forecast can be ingested. FACT compares archived forecasts against local observations at the same place and time, so you can see how your current provider performs by variable and lead time.
How do you know an observation is trustworthy?
Supported stations sign observations at the source. Every observation then passes automated Quality of Data checks for plausibility, consistency and deployment context. We publish our methods — including comparisons with WMO reference stations and faults we found in our own fleet.
What if there are no stations where we operate?
We deploy them. Tell us the sites and the decision the data must support; we choose the hardware and connectivity for each site (Wi-Fi, LoRaWAN, cellular or mesh) and deliver the data through the same API.
Who do we contract with?
WeatherXM AG provides the commercial relationship, delivery, APIs and support. The independent WeatherXM Network Association governs the contributed Network Dataset and its licensing framework.
Start with your locations.
Send us the sites that matter, the variables and history you need, and the decision the data has to support. We will check coverage, show you how forecasts perform there, and scope access or new stations around it.
WeatherXM AG provides the commercial relationship, delivery, APIs and support. The independent WeatherXM Network Association ↗ governs Network participation and the Network Dataset licensing framework.