
Forecast accuracy tracking (FACT)
Don't guess which forecast is best. Measure it.
FACT keeps every forecast exactly as it was issued, then scores it against what a WeatherXM station measured at the same place and time. Forecast quality becomes something you can examine by location, variable and lead time, not a claim you have to take on trust.
The full 2025 archive is public at fact.weatherxm.com ↗.
- 1.83B
- forecast evaluations
- 45
- forecast models compared
- 8,927
- quality-checked stations (QoD ≥ 0.8)
- 322 days
- 13 Feb – 31 Dec 2025
Source: WeatherXM FACT, 2025 archive ↗
How FACT works
Most forecast providers don't publish how wrong their forecasts turned out to be. WeatherXM operates the observation layer, so it can keep each forecast as issued and check it against the ground afterwards.
Keep the forecast as issued
Each model run is archived per model, per variable and per lead time, up to a week ahead. It is stored before the event, with its issue time, target time and model identity.
Measure what actually happened
When the forecast hour arrives, a WeatherXM station at that location records the actual weather. Only stations that pass Quality of Data (QoD) checks are used.
Turn the gap into a measurement
The gap between forecast and measurement is the error. Averaged over the evaluation period, it shows how far off each model really is. Rain is also scored on whether it rained at all, using the Heidke Skill Score (≥ 0.25 mm/day).
The full methodology covers how forecasts and observations are paired, scored and pooled, why the comparison is fair, and the limitations we know about.
Read the full methodology ↗What measuring forecasts reveals
Weather models disagree, and their performance changes by place, by variable and by lead time. A year of ground truth makes those differences visible.
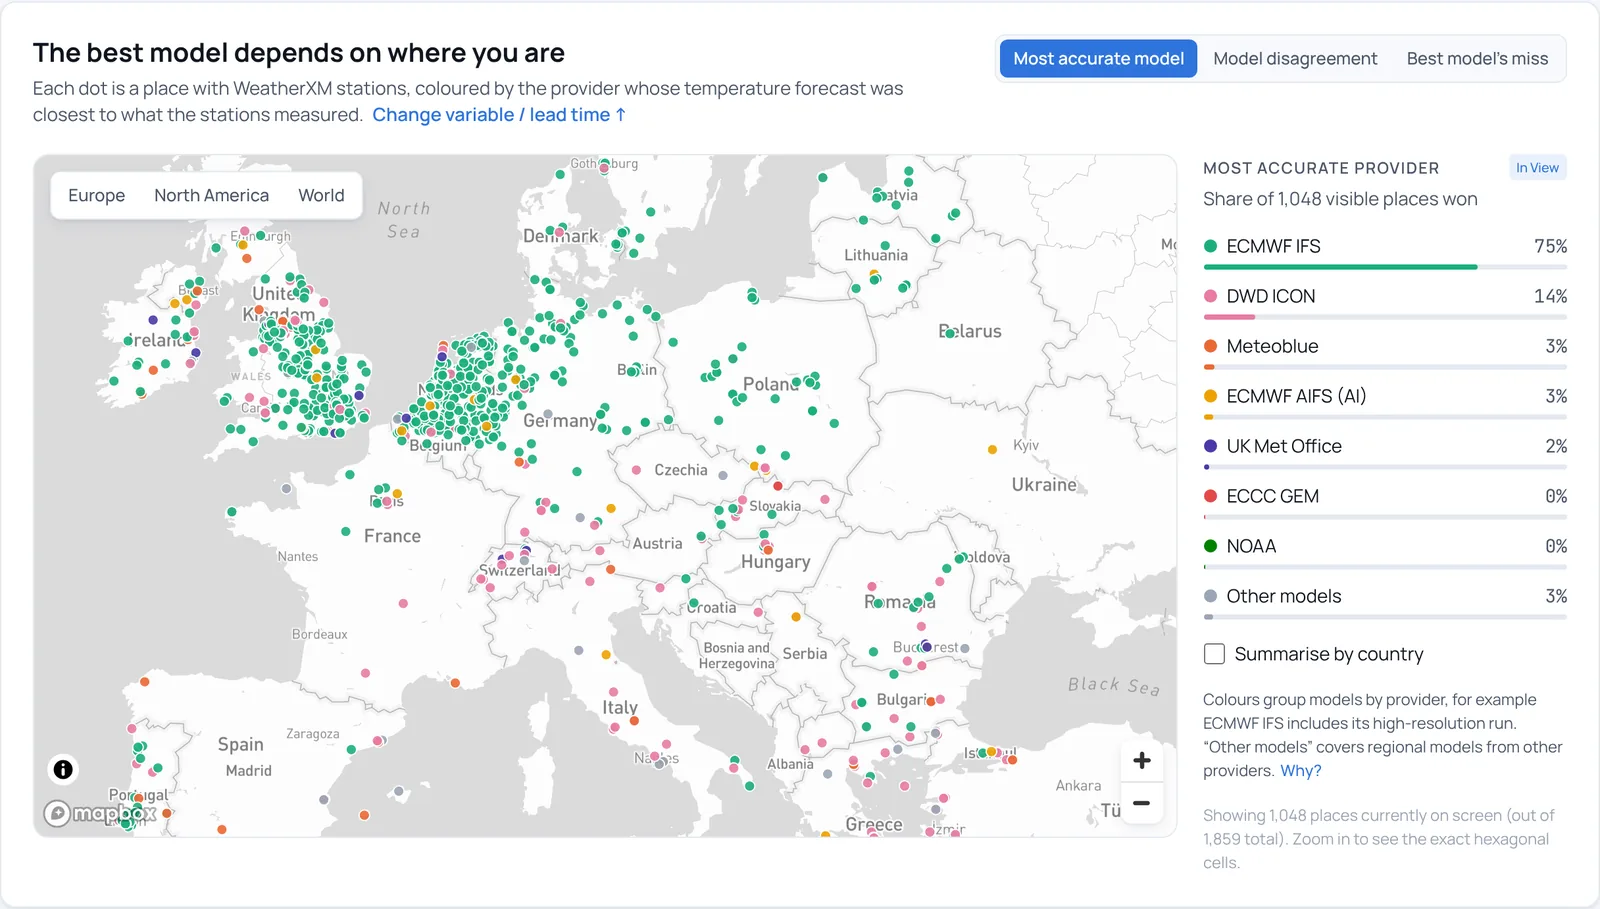
No single model is best everywhere.
A model that leads on average can trail in a valley, on a coast or in a city. The local leader changes with place, season and lead time. FACT maps which model wins where.
See the map ↗Lead time matters, but not equally.
For temperature, the further ahead, the bigger the miss. Wind error barely changes with lead time. That points to local effects, such as station height or nearby obstacles, that a model grid cannot resolve.
Compare lead times ↗Rain is a yes/no question first.
For many decisions the question is whether it will rain, not exactly how much. FACT scores rain detection with the Heidke Skill Score and lets you inspect each model's hits, misses and false alarms.
Inspect rain skill ↗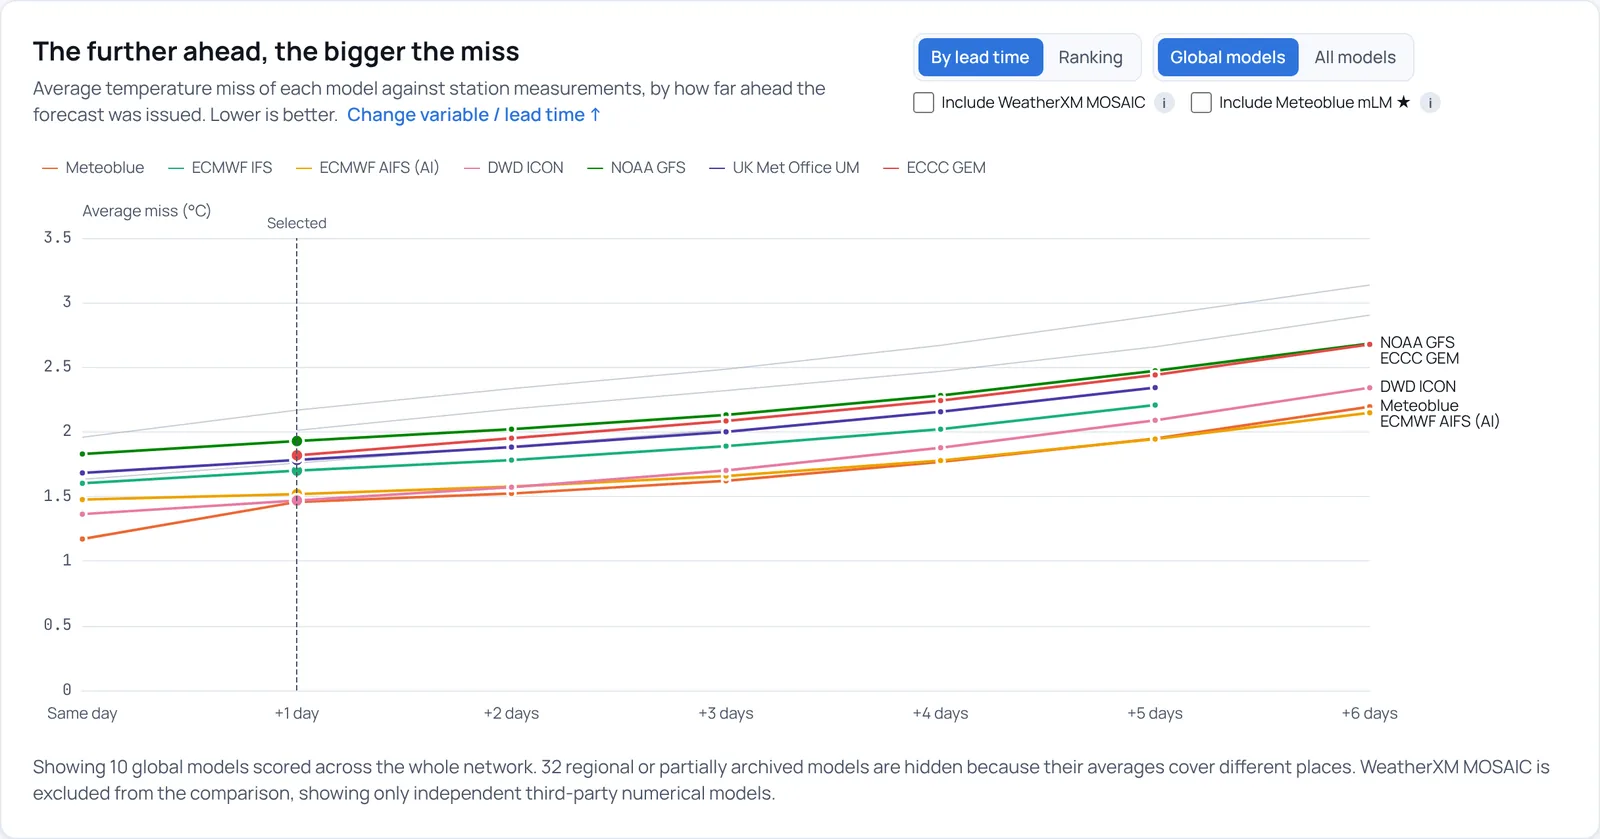
Explore the archive yourself.
Pick a variable and a lead time, rank the models across the network, and zoom into individual places on the map. Every number on FACT comes from a real, dated evaluation.
45 models, compared on a fair basis
The 2025 archive covers global and regional physics models, AI weather models and post-processed forecasts.
Global physics models
ECMWF IFS, NOAA GFS, DWD ICON, UK Met Office, Météo-France, Environment Canada GEM and others, scored across the whole network.
High-resolution regional models
HRRR and NAM over North America, ICON-EU and ICON-D2, COSMO, HARMONIE, JMA MSM and other regional runs. Each is scored only inside its own domain.
Machine-learning models
ECMWF's AIFS is scored against the same ground stations as the physics-based models.
Station-tuned forecasts
meteoblue Learning MultiModel (mLM), commissioned for about 50 WeatherXM customer stations, and WeatherXM's own Mosaic.
Why the comparison is fair
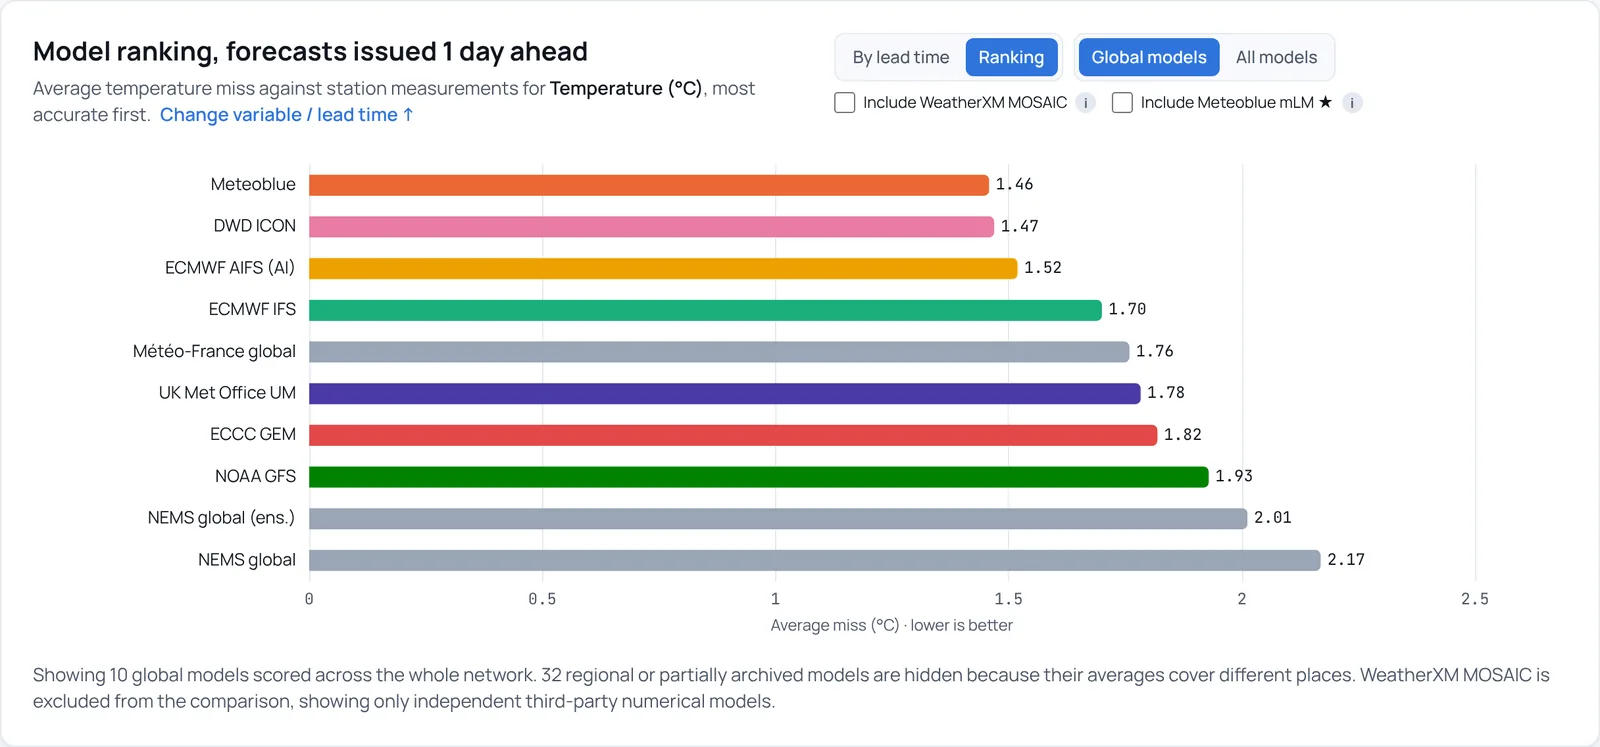
Averages are only compared between models scored on the same stations. Regional models are shown apart from global ones. Commissioned forecasts are marked and kept out of network-wide figures. And because WeatherXM both runs FACT and builds Mosaic, Mosaic can be switched off in every view.
How models are compared ↗Mosaic: the forecast built from FACT
Once you can rank models against the ground, you can stop picking one. For every station and every day ahead, Mosaic looks back over up to 15 days of FACT results at that station and uses the model that has recently performed best there.
Mosaic is tuned and scored on the same stations. Read its FACT scores as what local model selection achieves at a station, not as a like-for-like model comparison.
Mosaic is not a self-service product. We enable it per location in enterprise engagements.
How Mosaic is assembled
Want FACT for your own sites?
The public archive is a sample. For your locations, we score every model at your site, by variable and lead time, on the full archive.
A station at your site
WeatherXM hardware puts ground truth where your decisions are made, not at the nearest airport.
Compare stations →FACT analytics for that location
Every model scored against your station, so you know which forecast to trust. Already pay for a forecast? Where supported, we evaluate it alongside the others.
Discuss a FACT evaluation →A forecast tuned to your station
Mosaic, enabled per location, builds your forecast from the models that have proved themselves there.
About Mosaic →No evaluation crowns one forecast as best for every place and every condition. That answer doesn't exist, which is exactly why it is worth measuring.
See how wrong the forecasts were
Explore the 2025 archive on FACT. Then bring us your locations, variables and decision criteria, and we will scope an evaluation with you.
Back to Data & Forecasts →